
📉 EIA Natural Gas Storage Report – Week Ending September 25, 2026

Natural Gas Storage Build Falls Short of Expectations as Regional Tightness Continues to Shape Market Risk
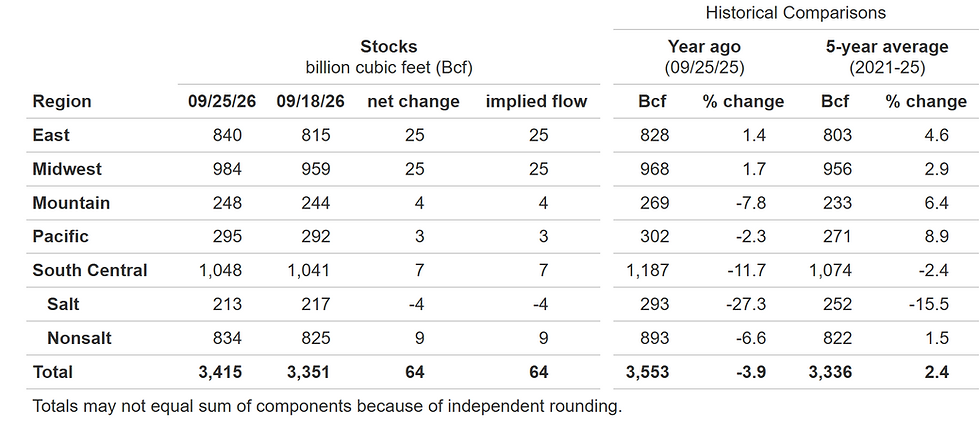
The latest EIA Weekly Natural Gas Storage Report delivered another reminder that the U.S. natural gas market remains a story of regional fundamentals rather than headline inventory levels. Working gas in storage increased by 40 Bcf for the week, lifting total inventories to approximately 3.25 Tcf, yet storage remains below year-ago levels despite remaining comfortably above the five-year average.
For commercial and industrial energy buyers, today's report highlights a market that continues to walk a fine line between adequate supply and emerging regional constraints. While inventories have generally recovered from the concerns that dominated previous injection seasons, the composition of those inventories and where they are located may ultimately determine price direction heading into winter.
At Premier Energy Management (PEM), we believe this week's report reinforces a key market theme: national storage is healthy, but regional supply dynamics are becoming increasingly important.
National Storage Snapshot
According to the EIA, U.S. working gas inventories now stand at approximately:
Metric | Volume |
Total Working Gas in Storage | 3,254 Bcf |
Weekly Change | +40 Bcf |
Versus Last Year | 79 Bcf Lower |
Versus Five-Year Average | 148 Bcf Higher |
Percent Above 5-Year Average | 4.8% |
The storage build was sufficient to continue replenishing inventories ahead of winter, but the market remains focused on the fact that storage levels continue to trail those seen this time last year.
That gap has narrowed in recent months, yet it remains an important indicator as traders evaluate winter reliability and price risk.
Regional Storage Analysis
A deeper look at the regional data reveals several noteworthy developments.
East Region
The East region posted one of the strongest storage increases of the week.
Current Storage Level
773 Bcf
Weekly Change
+20 Bcf
Comparison to Last Year
+2.5%
Comparison to Five-Year Average
+5.9%
The East continues to build inventories at a healthy pace. However, demand centers across the Northeast remain vulnerable to weather-driven demand spikes and pipeline constraints.
For Mid-Atlantic energy buyers, the region's storage position remains supportive but does not eliminate basis risk during high-demand periods.
Midwest Region
The Midwest remains one of the most balanced storage regions in the country.
Current Storage Level
908 Bcf
Weekly Change
+18 Bcf
Comparison to Last Year
+2.5%
Comparison to Five-Year Average
+4.4%
Strong inventories across the Midwest continue to provide stability to the national storage picture. While the region is comfortably supplied, weather developments could still influence flows into neighboring markets during the upcoming heating season.
South Central Region
The South Central region produced perhaps the most interesting data point in today's report.
Current Storage Level
1,044 Bcf
Weekly Change
-7 Bcf
Comparison to Last Year
-8.7%
Comparison to Five-Year Average
+2.0%
Despite a nationwide storage increase, the South Central region posted a withdrawal.
This regional decline reflects strong demand dynamics and continued balancing activity within one of the most operationally significant supply regions in North America.
Salt Storage
Salt facilities declined:
Previous Week: 238 Bcf
Current Week: 227 Bcf
Weekly Change: -11 Bcf
Nonsalt Storage
Nonsalt facilities increased:
Previous Week: 813 Bcf
Current Week: 817 Bcf
Weekly Change: +4 Bcf
The continued drawdown of salt storage remains one of the market's most closely watched indicators because salt facilities provide rapid supply flexibility during periods of elevated demand.
Pacific Region
The Pacific region registered a modest increase.
Current Storage Level
290 Bcf
Weekly Change
+5 Bcf
Comparison to Last Year
-1.0%
Comparison to Five-Year Average
+10.3%
Although inventories remain above historical norms, storage levels continue to track slightly below last year's pace.
This remains important because Western markets often experience pronounced price reactions when weather events or infrastructure constraints emerge.
Mountain Region
The Mountain region showed continued improvement.
Current Storage Level
239 Bcf
Weekly Change
+3 Bcf
Comparison to Last Year
-7.0%
Comparison to Five-Year Average
+8.6%
While inventories remain below year-ago levels, the region continues to maintain a comfortable cushion relative to historical averages.
Five Key Market Takeaways
1. Inventories Remain Below Last Year
Despite months of injections, national storage remains approximately 79 Bcf below year-ago levels. This indicates that the market has yet to completely erase last winter's storage deficit.
2. Storage Is Still Well Above Historical Norms
Inventories remain approximately 148 Bcf above the five-year average, providing a meaningful supply cushion as the industry moves toward winter.
3. Regional Divergence Is Growing
The East and Midwest continue posting healthy injections while the South Central region remains more dynamic due to ongoing salt storage activity.
4. South Central Salt Storage Deserves Attention
The week's 11 Bcf withdrawal from salt storage may be one of the most important figures in the report. Salt facilities typically reflect near-term market balancing activity and often provide early indications of changing supply-demand conditions.
5. Winter Risk Is Slowly Emerging
Although current inventories remain healthy, production growth has moderated, and LNG demand remains elevated. As a result, storage injections over the next several weeks will be increasingly important in determining winter market sentiment.
What This Means for PEM Clients
For commercial and industrial energy users, today's report supports a balanced but cautious approach.
Current storage levels do not signal an immediate supply concern. However, the combination of:
Inventories below last year
Ongoing South Central salt withdrawals
Regional basis volatility
Weather uncertainty
LNG export demand growth
PEM continues to recommend a layered purchasing approach that balances market opportunity with budget certainty. Waiting for a perfect market entry point becomes increasingly risky as the industry moves closer to winter withdrawal season.
PEM Outlook
The natural gas market enters September with adequate inventories but increasing regional complexity. Today's report demonstrates that while national storage appears comfortable, underlying regional shifts continue to create pockets of volatility.
Market participants should monitor:
Weekly storage injections
South Central salt storage activity
Weather forecasts
LNG export demand
Appalachian production trends
Regional basis movements
These factors are likely to exert greater influence on pricing than headline storage levels alone over the coming months.
As always, PEM will continue monitoring market developments and helping clients navigate changing conditions through proactive procurement strategies and data-driven energy intelligence.
#PEMInsights #NaturalGas #EIAStorageReport #EnergyMarkets #EnergyProcurement #NaturalGasStorage #EnergyRiskManagement #CommodityMarkets #HenryHub #BasisMarkets #LNG #EnergyManagement #CommercialEnergy #IndustrialEnergy #EnergyConsulting #MarketIntelligence #NaturalGasMarket #EnergyStrategy #PremierEnergyManagement #PEMMarketUpdate
Sources:
Natural Gas Futures
Read more: EIA
Winter is almost here...
When was the last time you reviewed your facility's Energy plan?
What are you waiting for?
We are here to help...


Comments