
📉 EIA Natural Gas Storage Report – Week Ending August 7, 2026

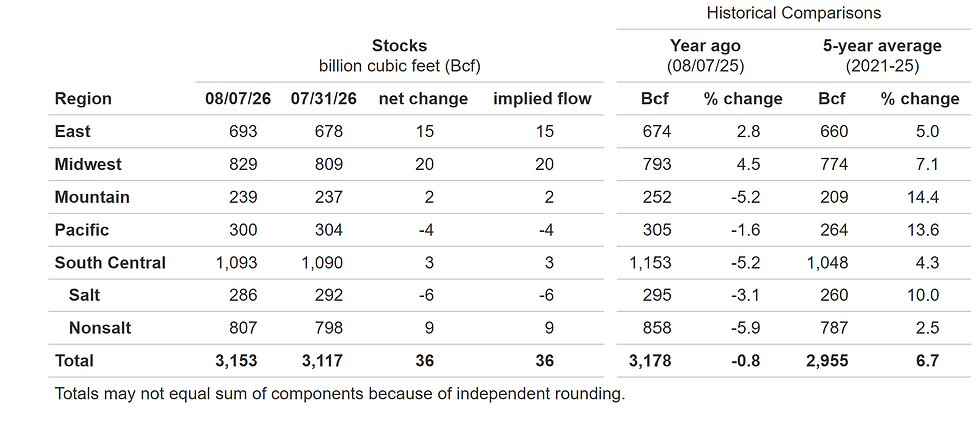
Working gas in U.S. underground storage increased 36 Bcf for the week ending August 7, 2026, bringing total inventories to 3,153 Bcf. Stocks now sit 198 Bcf above the five‑year average and 25 Bcf below last year’s level.
While total inventories remain within the five‑year historical range, PEM’s analysis shows that regional imbalance — not national totals — is the real driver of late‑summer market risk.
Heat-driven demand, production variability, and tightening in key regions are creating conditions where basis volatility can emerge quickly, especially for Mid‑Atlantic and Northeast buyers.
Regional Storage Breakdown
(All data sourced from today’s EIA report.)
East Region
693 Bcf, up 15 Bcf
2.8% above last year
5.0% above the five‑year average
The East continues to build, but the year‑over‑year margin remains thin. For buyers in Delaware, Maryland, Pennsylvania, Massachusetts, New England, and New Jersey, this means basis firmness remains a risk during heat waves.
Midwest Region
829 Bcf, up 20 Bcf
4.5% above last year
7.1% above the five‑year average
The Midwest remains structurally strong, offering stability — but its influence on Mid‑Atlantic pricing is indirect.
Mountain Region
239 Bcf, up 2 Bcf
5.2% below last year
14.4% above the five‑year average
Mountain region weakness often foreshadows volatility in western flows and can ripple into national sentiment.
Pacific Region
300 Bcf, down 4 Bcf
1.6% below last year
13.6% above the five‑year average
The Pacific draw is notable. Historically, Pacific deficits have been early indicators of winter volatility, especially when paired with LNG export demand and pipeline constraints.
South Central Region
1,093 Bcf, up 3 Bcf
Salt caverns: 286 Bcf, down 6 Bcf
Nonsalt: 807 Bcf, up 9 Bcf
5.2% below last year
4.3% above the five‑year average
The 6 Bcf salt withdrawal is the standout data point of the week. Salt storage is the most flexible component of the U.S. system — and draws here often signal short‑term balancing needs or shifts in production flows.
PEM Analysis: What Today’s Report Really Means
1. Total Storage Looks Comfortable — But That’s Misleading
National totals mask meaningful regional tightening. The East and Pacific regions show signs of stress relative to last year, increasing the likelihood of basis volatility.
2. Salt Storage Withdrawals Are a Warning Signal
Salt cavern withdrawals often precede short‑term volatility. Today’s 6 Bcf salt draw suggests balancing needs are emerging despite healthy national totals.
3. Production Growth Is Slowing
With Henry Hub prices hovering near multi‑month lows and rig counts declining, production growth is moderating. This could limit future builds and increase sensitivity to weather-driven demand.
4. Regional Divergence Will Drive September Pricing
As we move deeper into August, regional spreads — not national totals — will determine procurement outcomes. Buyers who rely solely on headline storage numbers risk missing early signals of tightening.
PEM Strategic Guidance for Mid‑Atlantic & Northeast Buyers
PEM advises clients to:
Monitor regional spreads weekly, not just national totals
Lock in partial volumes during periods of price softness
Avoid overexposure to short‑term volatility windows
Use structured procurement strategies to balance risk and opportunity
Leverage PEM’s real‑time market intelligence to stay ahead of regional shifts
Our team continues to track storage behavior, production trends, weather models, and pipeline constraints to ensure clients make informed, data‑driven decisions.
Bottom Line
Total U.S. natural gas storage is stable — but stability does not equal predictability. Regional divergence, salt storage withdrawals, and shifting production economics are creating a more complex landscape heading into late summer.
PEM remains committed to delivering clear, actionable intelligence that helps organizations navigate uncertainty with confidence.
#EnergyMarkets #NaturalGas #EIAData #PEMInsights #EnergyStrategy #EnergyProcurement #CommodityRisk #MarketVolatility #EnergyManagement #MidAtlanticEnergy #NaturalGasStorage #EnergyConsulting #PEMMarketIntelligence
Sources:
Natural Gas Futures
Read more: EIA
When was the last time you reviewed your facility's Energy plan?
What are you waiting for?
We are here to help...


Comments